Technical view of the markets

A long term forecast in technical analysis should always be combined with thoughts that were established back in the 1930’s by the greatest pioneers in this analysis methods.
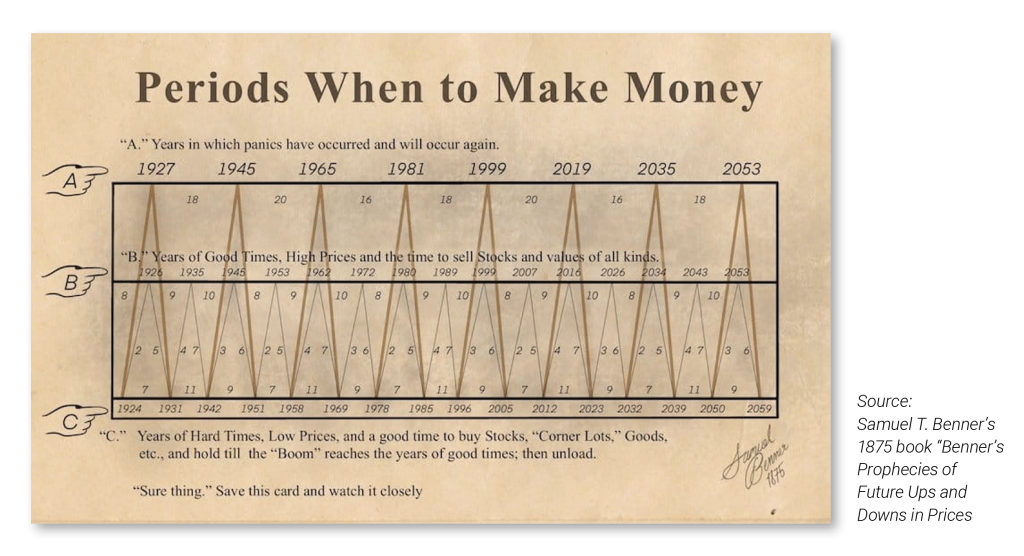
One of these working examples is the Benner Cycle, which proved to be a rock solid method in the past century. The Benner Cycle, developed in 1875 by farmer-analyst Samuel Benner, is a long-term market rhythm model built on recurring historical patterns of booms, busts and panics observed in 19th-century commodity and financial markets.
According to the Benner Cycle’s long-term pattern, 2026 may mark the final leg of the current multi-year market upswing—a late-cycle rally that often arrives suddenly and unexpectedly. The structure of the cycle suggests that while the broader trend into 2026 remains upward, investors may be approaching a pivotal turning point similar to previous peaks observed in 1999, 2007 and 2016.
In all three cases, markets experienced strong acceleration before the cycle shifted. Two of these moments—1999 and 2007—were followed by significant price corrections, while 2016 produced a correction in time rather than in price, with markets consolidating sideways before resuming their advance.
If the Benner pattern holds, 2026 could therefore represent both opportunity and heightened risk: the final phase of a long rally, but also a period when vigilance, diversification and disciplined positioning become increasingly essential.
S&P 500
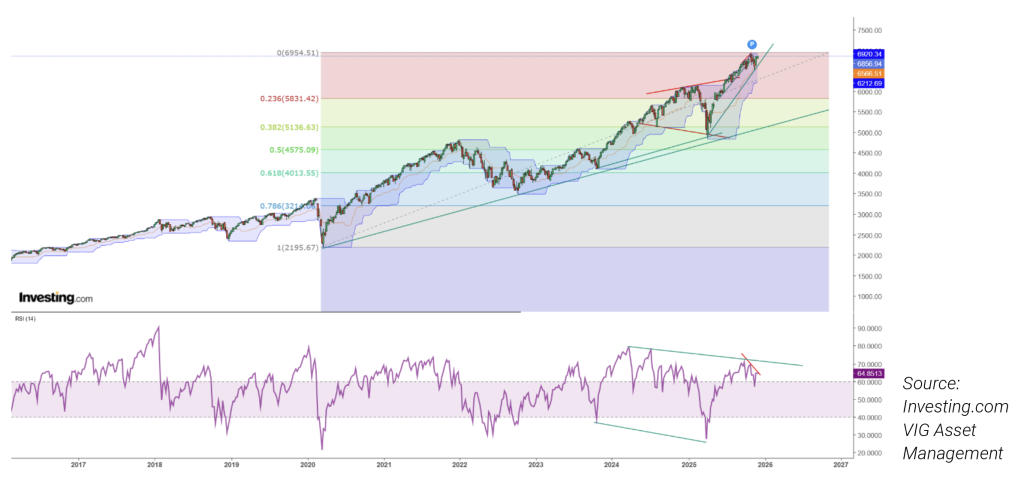
Looking at the long-term performance outlook of the S&P 500, we can clearly see the magnitude of the rally that this leading index has delivered. We are approaching the end of the fifth Elliott wave in the 2025 upward leg, which may not have fully completed yet. The index has turned parabolic this year, and when combined with an RSI showing weakening market strength through lower highs, this could serve as an early warning signal for the entire year ahead.
The S&P 500 will most likely experience a correction in the coming months; however, given the strong underlying fundamentals, this correction may unfold more in time than in price—resulting in a longer period of sideways movement rather than a sharp decline. After such a parabolic advance, the forecasted yearly performance is expected to be lower than in 2025 and could even fall below the average annual returns of the past five years.
NASDAQ composite
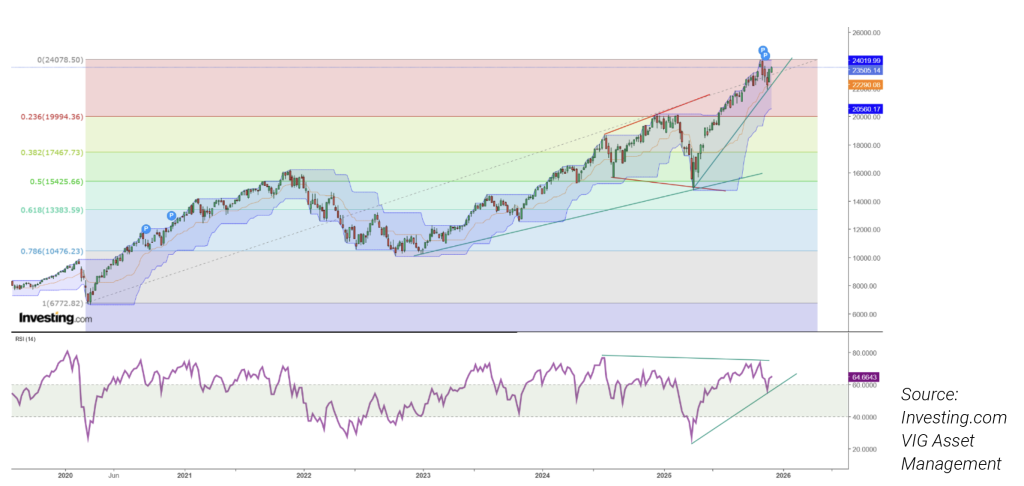
A similar performance pattern appears on the Nasdaq Composite chart, showing the same parabolic advance. Based on the RSI, this index still looks stronger than the S&P 500, yet a correction is also due here. Given the inherently more volatile nature of the Nasdaq, this correction will most likely occur through price rather than time, potentially bringing the index down toward the 20,000 level before the broader trend resumes. Over the course of the year, a predominantly sideways movement is expected in the coming months, resulting in below-average overall performance.
Crude oil WTI
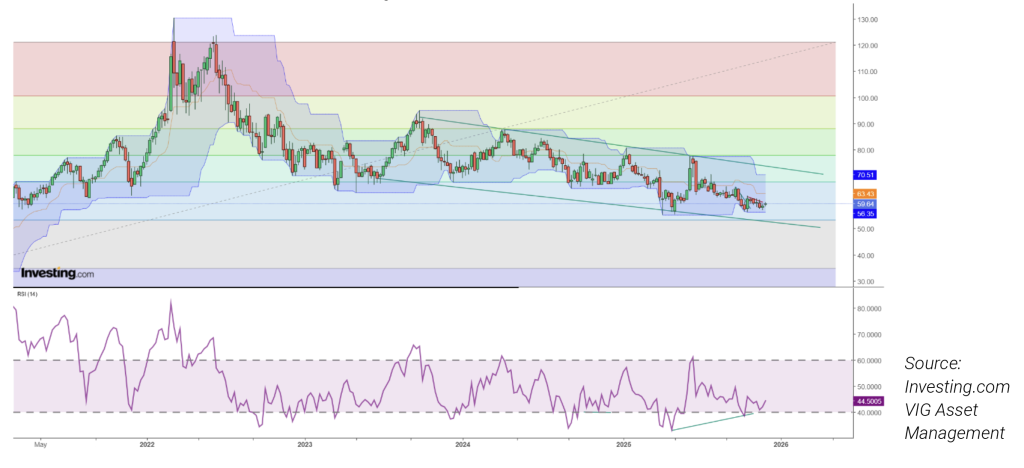
WTI remains in a long-term downward trend, which appears set to continue. However, the slope of this decline has shifted into a more sideways pattern, keeping WTI contained between the 60–80 USD range. The upward-ticking RSI also indicates a weakening of the multi-year downtrend, suggesting that this trading band will most likely persist through 2026.
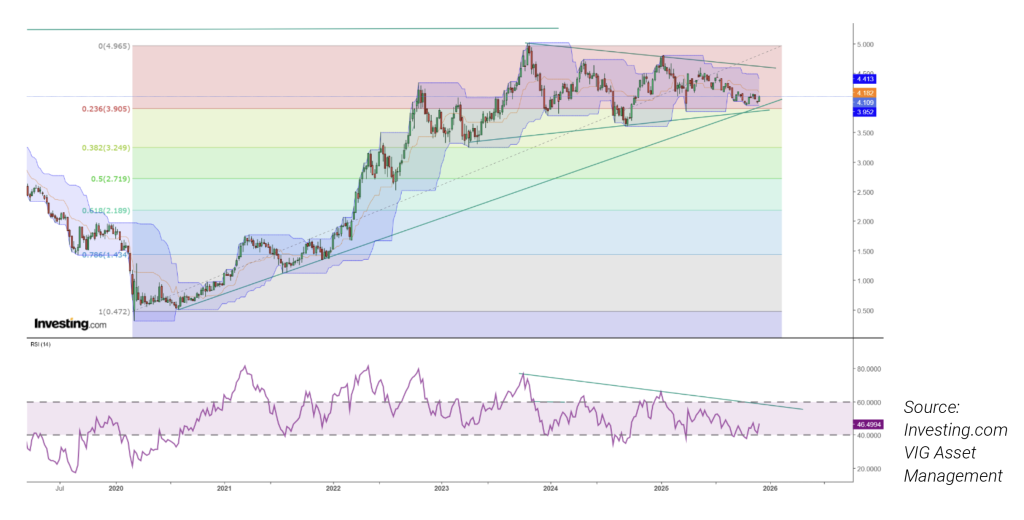
US 10YR
U.S. long-term yields have moved sideways with a slight downward bias in recent years. The chart has formed a triangle pattern, and its eventual breakout will signal the next major directional move. Current indications suggest that 10-year yields may break lower, falling through both the long-term rising support line and the lower boundary of the triangle. The declining RSI reinforces this view. Should this breakdown occur in the early weeks of 2026, it would likely mark the beginning of a sustained downward yield trend that could persist throughout 2026—and potentially even longer.
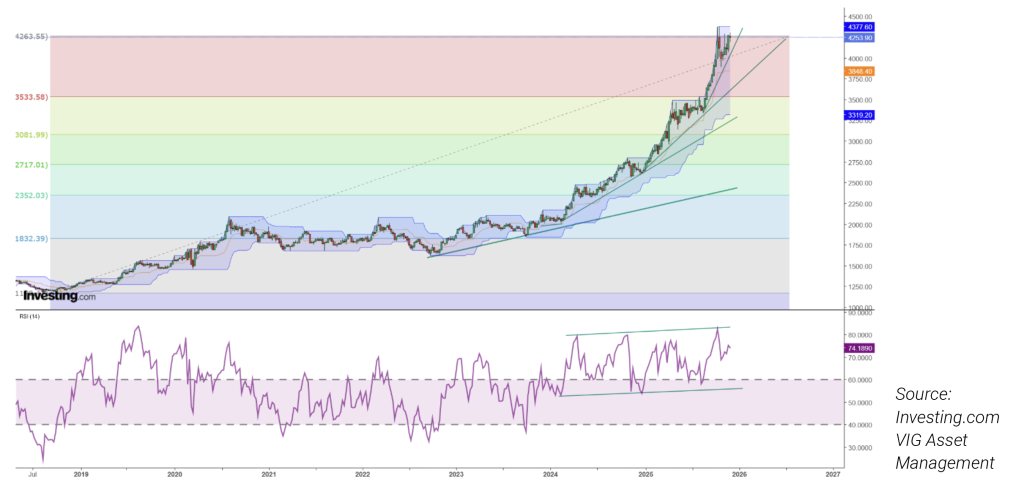
GOLD
Gold has made an exuberant move in recent years—one that is unusual when compared with the broader performance of equity markets. The advance has turned parabolic, supported by extreme RSI readings. Such conditions typically signal a highly overvalued market that may be vulnerable to a bubble-like correction. While this has not yet appeared on the current chart, a decline in Gold that pushes the RSI below 40 at any point in 2026 would likely accelerate the price correction. In an overextended market such as this, 10–15% pullbacks are normal, and if the RSI rule holds, these could present attractive buying opportunities.
További cikkekBefektetési Kilátások 2026 Dokumentum megtekintéseLetöltés
Ez egy forgalmazási közlemény. A megalapozott befektetési döntés meghozatalához részletes tájékozódásra van szükség. Az Alap befektetési politikájáról, forgalmazási költségeiről és a befektetés lehetséges kockázatairól részletesen tájékozódjon az Alap forgalmazási helyein és az Alapkezelő weboldalán (www.vigam.hu) található Kiemelt Információkból, hivatalos tájékoztatóból és kezelési szabályzatból. A befektetési alap forgalmazásával (vétel, tartás, eladás) kapcsolatos költségek az alap kezelési szabályzatában és a forgalmazási helyeken megismerhetők. A múltbeli teljesítmény alapján nem jelezhetőek előre a jövőbeli hozamok. A befektetéssel elérhető jövőbeni hozam adóköteles lehet, az egyes pénzügyi eszközökre, ügyletekre vonatkozó adó- és illeték információkat pedig csak az egyes befektetők egyedi körülményei alapján lehet pontosan megítélni, ami a jövőben változhat. A befektető feladata, hogy tájékozódjon az adókötelezettségről. Jelen tájékoztatóban szereplő adatok kizárólag információs célokat szolgálnak és nem minősülnek befektetési ajánlásnak, ajánlattételnek vagy befektetési tanácsadásnak. A VIG Befektetési Alapkezelő Magyarország Zrt. nem vállal felelősséget a jelen tájékoztatás alapján hozott befektetési döntésért és annak következményeiért.
Az Alapkezelő alternatív befektetési alap kezelésére (ABAK) vonatkozó engedélyének száma: H-EN- III-6/2015. Az Alapkezelő ÁÉKBV-alapkezelési (kollektív portfóliókezelési) engedélyének száma: H- EN-III-101/2016.