How long will the market tolerate high public debt levels?

Is Yield Curve Control (YCC) coming?
In the early 2010s, the European – primarily Greek – debt crisis repeatedly unsettled investor sentiment. To help keep debt levels under control, alongside fiscal tightening, the European Central Bank also introduced several measures: it launched liquidity and bond-purchase programs, and, in a previously unimaginable move, cut the deposit rate into negative territory, all the way down to –0.5%. The 2010s were defined by ZIRP (Zero Interest Rate Policy) both in the Eurozone and in the U.S., where, following the 2008 subprime crisis, the Fed reduced the policy rate to 0–0.25% and purchased mortgage-backed securities and Treasuries under its quantitative easing (QE) programs.
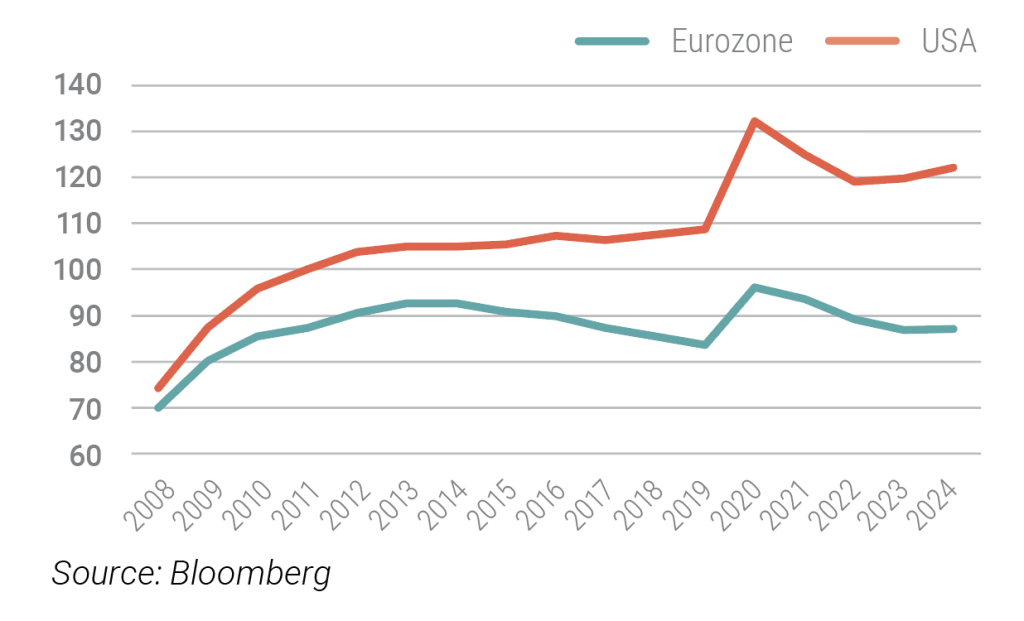
As a result of these measures, debt levels in Europe eased in the second half of the 2010s, while in the U.S. the growth rate of public debt slowed substantially. The next surge in indebtedness came with 2020 and the Covid shock: in the U.S., the debt-to-GDP ratio jumped from 109% to above 130%, while in the Eurozone it rose from 84% to 97%. Since Covid, however, the two economic regions have diverged: in the Eurozone, the debt ratio fell by nearly 10 percentage points, whereas in the U.S. debt to GDP ratio it is expected to rise close to 125% by the end of 2025.
Debt to GDP levels (%)
Accordingly, investors now tend to question the sustainability of U.S. debt dynamics. This has been reflected in the bond market through elevated term premiums, higher real yields, and the steepening yield curve. The outlook is further clouded by the fact that, based on the Trump administration’s previous policy actions, the U.S. budget deficit is likely to remain above 6% this year and in the coming years.
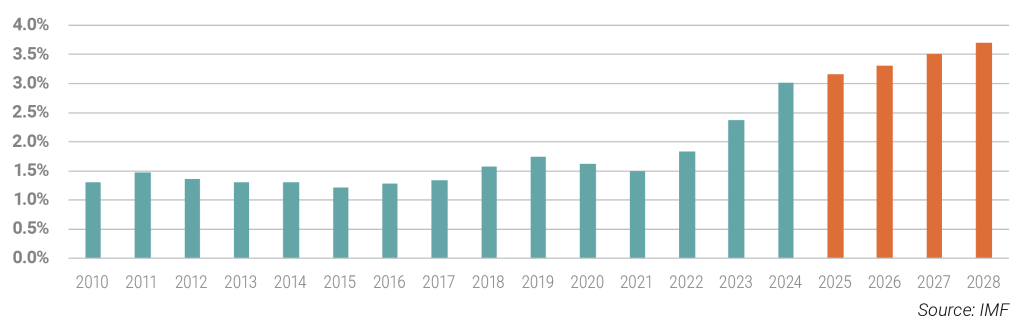
Meanwhile, debt-servicing costs are rising sharply: interest payments amounted to 3.0% of GDP in 2024 in the U.S., a steep increase compared with prior years. Based on current macroeconomic forecasts, the cost of interest payments on U.S. debt will continue to rise in the coming years. These developments have been reflected in sovereign credit ratings as well: in 2023, Fitch downgraded the U.S. from AAA to AA+, and in 2025 Moody’s downgraded it from Aaa to Aa1 (S&P had already cut the U.S. from AAA in 2011).
US debt service (interest payments to GDP, %) dynamics
For now, one can say that the market still finds the U.S.’s roughly 120% debt-to-GDP ratio acceptable, as it is neither historically nor internationally extreme. The relative stability of bond yields also supports this. However, confidence can quickly evaporate, as the debt trajectory is unsustainable under current parameters. A significant rise in bond yields would further increase financing costs, causing debt levels to spiral even more over the forecast horizon, which could eventually force some policy response – either fiscal (deficit reduction) or monetary (accelerated bond purchases).
Can We Expect Yield Curve Control (YCC) in the U.S. in 2026?
Policymakers have little direct influence over long-term yields – at least without the interventions noted above – since these are shaped primarily by market forces. Short-term yields, however, are easier to influence. U.S. Treasury Secretary Scott Bessent regularly criticizes the Fed’s leadership, as does President Trump, arguing that high interest rates harm the economy. The new Fed Chair – appointed by Trump – is therefore expected to further cut the policy rate next year, which would reduce yields on short-term Treasuries.
However, further rate cuts will only be credible if investors do not perceive rising inflation risks. Otherwise, higher inflation expectations would push up long-term yields (steepening the curve), increasing U.S. interest expenses on new debt issuance.
Policymakers have several tools available to control yields. Cutting the policy rate lowers short-term yields, so the Treasury may shift issuance toward shorter maturities, which become cheaper to finance as rates fall. Reduced supply of long-term bonds – assuming demand remains the same or falls more slowly – would also dampen long-term yields. Since keeping yields in check – that is, reducing the cost of debt financing – is economically desirable, it is quite possible that the new Trump-aligned Fed Chair taking office in May 2026 will expand the Fed’s balance sheet again, increasing central bank bond purchases. At the October Fed meeting, the FOMC already decided to maintain the level of asset purchases, ending the recent period of declining bond-buying volumes.
According to fund managers surveyed by Bank of America (BofA Global Fund Manager Survey), there is a 54% probability that the new Fed Chair – taking office in May 2026 – will attempt to push down long-term Treasury yields through quantitative easing (QE) or yield curve control (YCC), thereby reducing U.S. debt-servicing costs.
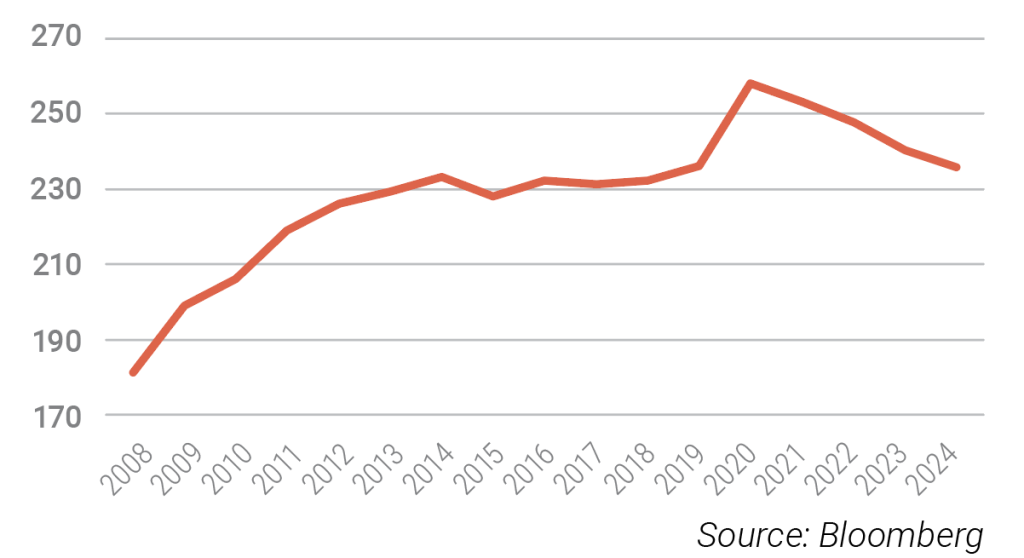
What Does Yield Curve Control Mean in Practice? YCC means that the central bank targets specific yield levels for certain maturities (e.g., 2-year or 10-year yields), and purchases government bonds – potentially in unlimited quantities – to maintain those targets. Japan introduced YCC in 2016, targeting a –0.1% short-term rate and a 0% 10-year yield. Japanese YCC can be considered relatively successful: it did not trigger significant inflation, supported the economy, and debt levels did not meaningfully increase further. However, the Japanese yen has depreciated by more than 40% against the dollar since 2021, as the Bank of Japan ramped up bond purchases to keep yields stable despite rising inflation.
Debt to GDP (%), Japan
If yield curve control is followed by surging inflation, this amounts to “financial repression”: investors who buy bonds at low nominal yields would end up earning negative real returns due to higher inflation.
Summary: Investors overall do not expect the Fed to implement yield curve control starting in 2026, but short-term economic policy goals catalysed by a new Fed leadership could easily lead to stronger monetary support: in addition to cutting rates, the Fed may once again expand its balance sheet and purchase more Treasuries.
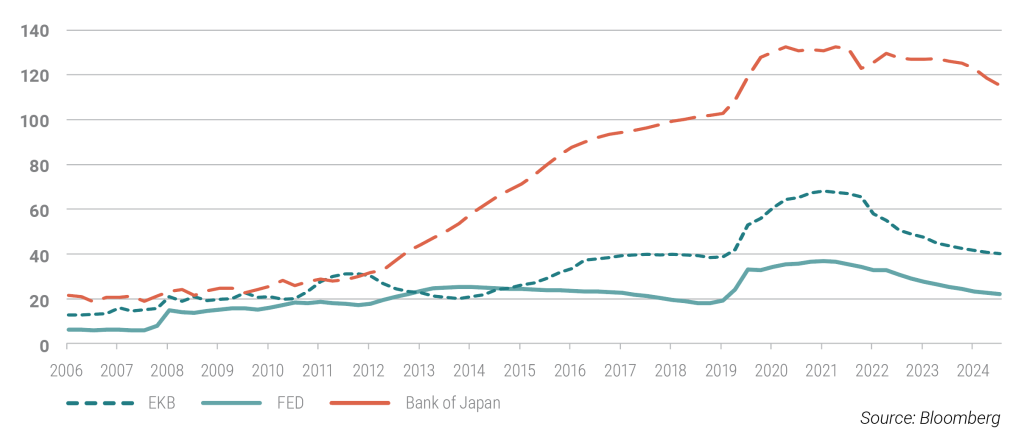
In this case, the U.S. would increasingly become a “high-pressure economy,” where both fiscal and monetary policy are expansionary. Instead of the previously typical ~4% deficit (2000–2019 average), a 6% deficit could become the “new normal,” and the Fed’s balance sheet may grow again. Strong fiscal and monetary stimulus alike increase the supply of dollars, which carries medium-term inflation risks and suggests further structural depreciation of the USD.
Central bank balance sheets to GDP (%)
További cikkekBefektetési Kilátások 2026 Dokumentum megtekintéseLetöltés
Ez egy forgalmazási közlemény. A megalapozott befektetési döntés meghozatalához részletes tájékozódásra van szükség. Az Alap befektetési politikájáról, forgalmazási költségeiről és a befektetés lehetséges kockázatairól részletesen tájékozódjon az Alap forgalmazási helyein és az Alapkezelő weboldalán (www.vigam.hu) található Kiemelt Információkból, hivatalos tájékoztatóból és kezelési szabályzatból. A befektetési alap forgalmazásával (vétel, tartás, eladás) kapcsolatos költségek az alap kezelési szabályzatában és a forgalmazási helyeken megismerhetők. A múltbeli teljesítmény alapján nem jelezhetőek előre a jövőbeli hozamok. A befektetéssel elérhető jövőbeni hozam adóköteles lehet, az egyes pénzügyi eszközökre, ügyletekre vonatkozó adó- és illeték információkat pedig csak az egyes befektetők egyedi körülményei alapján lehet pontosan megítélni, ami a jövőben változhat. A befektető feladata, hogy tájékozódjon az adókötelezettségről. Jelen tájékoztatóban szereplő adatok kizárólag információs célokat szolgálnak és nem minősülnek befektetési ajánlásnak, ajánlattételnek vagy befektetési tanácsadásnak. A VIG Befektetési Alapkezelő Magyarország Zrt. nem vállal felelősséget a jelen tájékoztatás alapján hozott befektetési döntésért és annak következményeiért.
Az Alapkezelő alternatív befektetési alap kezelésére (ABAK) vonatkozó engedélyének száma: H-EN- III-6/2015. Az Alapkezelő ÁÉKBV-alapkezelési (kollektív portfóliókezelési) engedélyének száma: H- EN-III-101/2016.