Multi-Asset Quantitative Strategies- Navigating asset allocation with a quantitative lens

As we enter the new year, it is useful to review how systematic multi-asset strategies have behaved relative to a traditional global 60/40 portfolio and how they may be positioned for what is likely to remain a demanding macro environment.
This note focuses on two complementary, rules-based frameworks: Bold Asset Allocation (BAA)[1], which varies its risk exposure through a regime-switching mechanism, and Adaptive Asset Allocation (AAA)[2], which remains fully invested while reallocating risk across global asset classes. For benchmark, we take a traditional global 60/40 portfolio built from ACWI (global equity) and AGG (US bond).
Strategy design: regime-switching versus adaptive risk allocation
BAA is a dual-momentum, multi-asset strategy built around a simple regime signal. A “Global 13612” canary universe of SPY (S&P500), VEA (developed equity), VWO (emerging equity) and BND (bond) is used solely for risk management: at each month-end, a weighted average of 1-, 3-, 6- and 12-month returns is calculated, and the number of assets with negative momentum determines how much capital can be allocated to risky assets versus a defensive fixed-income basket. When breadth is strong the portfolio is fully invested; as more canary assets turn negative, the defensive allocation increases stepwise until the portfolio can become entirely defensive. Within the risky sleeve, a broader set of equity, credit, real-estate and commodity ETFs (exchange traded funds) is ranked by 12-month performance and the top four are equally weighted, while the defensive sleeve is invested in the single ETF with the lowest 12-month correlation to SPY, maximising diversification versus US equities.
AAA is more aggressive in its opportunity set but more nuanced in how it balances risk. The investable universe spans global equities, fixed income and alternatives via liquid ETFs. Each month begins with a cross-sectional momentum screen: a 126-day return signal is computed for every ETF, the universe is ranked, and the five strongest assets form the investable subset for the coming month. The second step is a minimum-variance optimisation that takes into account how these top-momentum assets interact. A forward-looking covariance matrix is estimated by combining 126-day rolling correlations of daily log returns with 20-day volatility estimates from the Yang–Zhang estimator. The covariance between any two assets is their realised correlation multiplied by the product of their annualised volatilities.
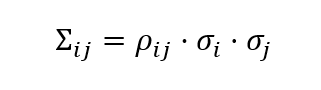
Given this matrix, portfolio weights are chosen by solving a long-only, fully invested minimum-variance problem. A cyclical coordinate descent algorithm iteratively adjusts pairs of weights while holding the others fixed, converging toward the allocation that minimises ex-ante portfolio variance.

In practice, this produces a concentrated yet risk-aware portfolio that tilts toward the strongest trends while allowing the optimiser to determine how much risk each position should carry.
Performance comparison
Both strategies are evaluated using daily total return data and monthly rebalancing, with a 10 basis-point transaction cost applied to changes in portfolio weights. The strategies are tested from 30 September 2008 to late November 2025, reflecting data availability.
Long-run performance statistics over the respective sample periods are summarised below.
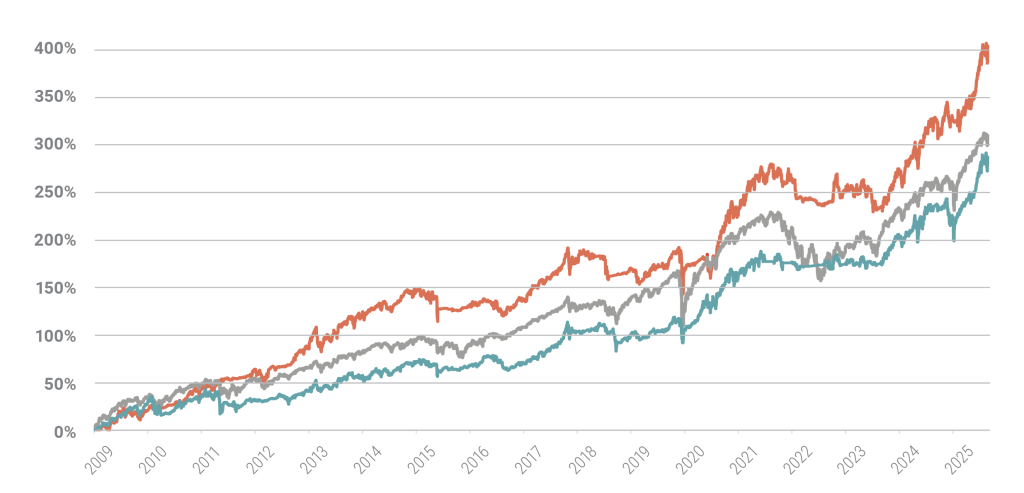
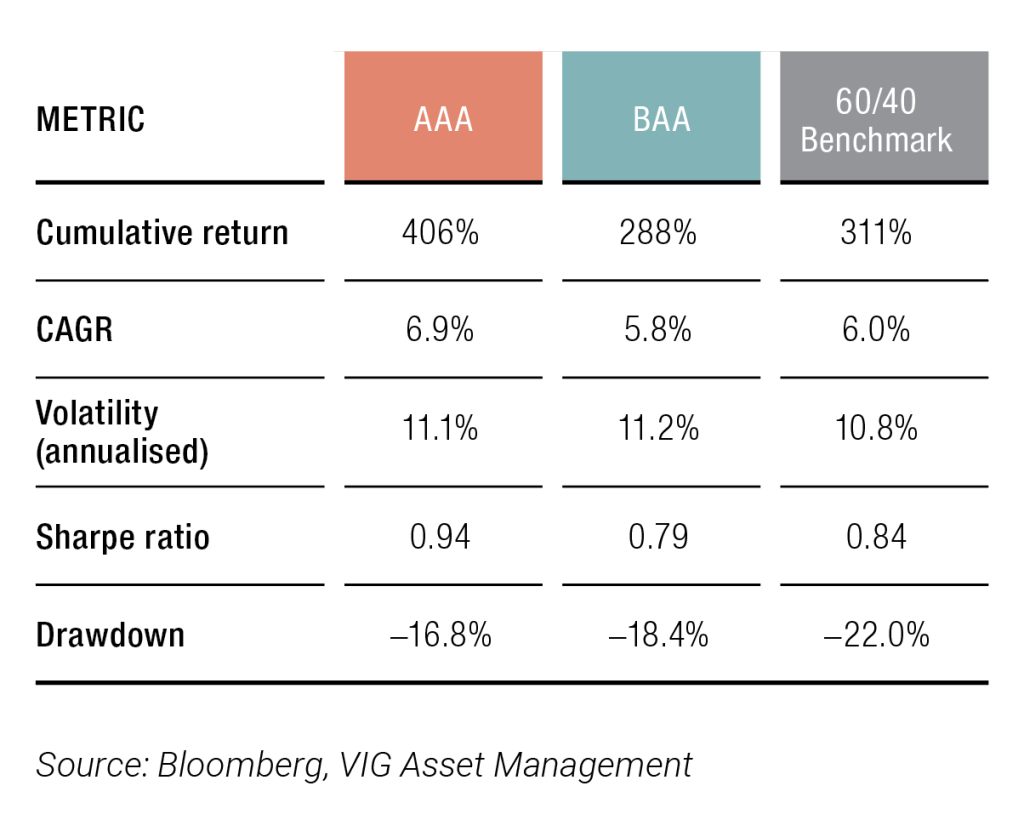
AAA has delivered the strongest overall profile, with the highest cumulative return and compound growth rate, lower volatility than the benchmark and materially better risk-adjusted measures. Its maximum drawdown is milder than those of the 60/40 portfolio, reflecting the benefits of combining momentum-driven selection with minimum-variance weighting. BAA offers a more modest return premium versus the benchmark but still improves the downside experience: drawdowns are smaller and drawdown-based measures (e.g. Calmar-ratio) all favour the strategy. The long-horizon equity curves show the same pattern: the 60/40 portfolio participates fully in equity bull markets but suffers deeper setbacks, while AAA pulls away over time and BAA tracks more closely but with smoother declines.
The shorter-term picture in 2025 is consistent with these long-run observations.
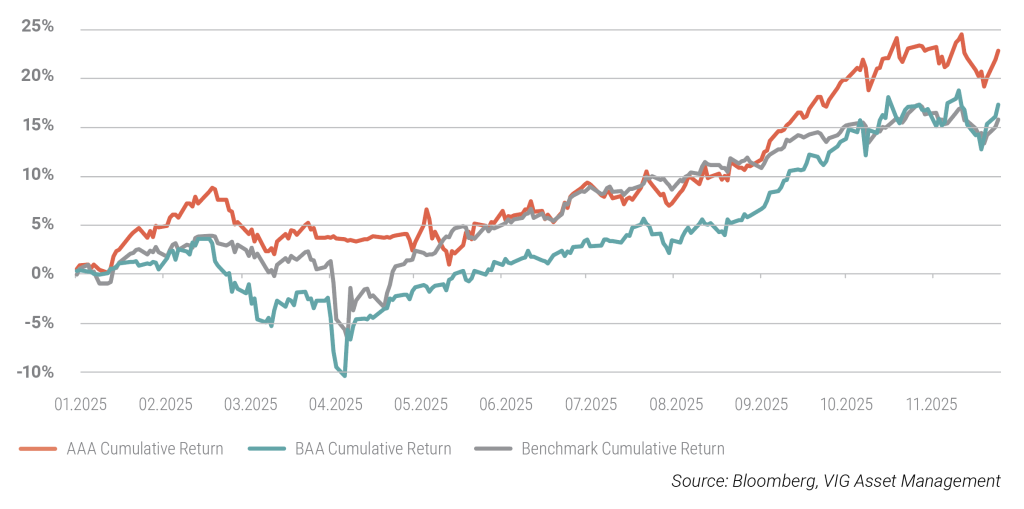
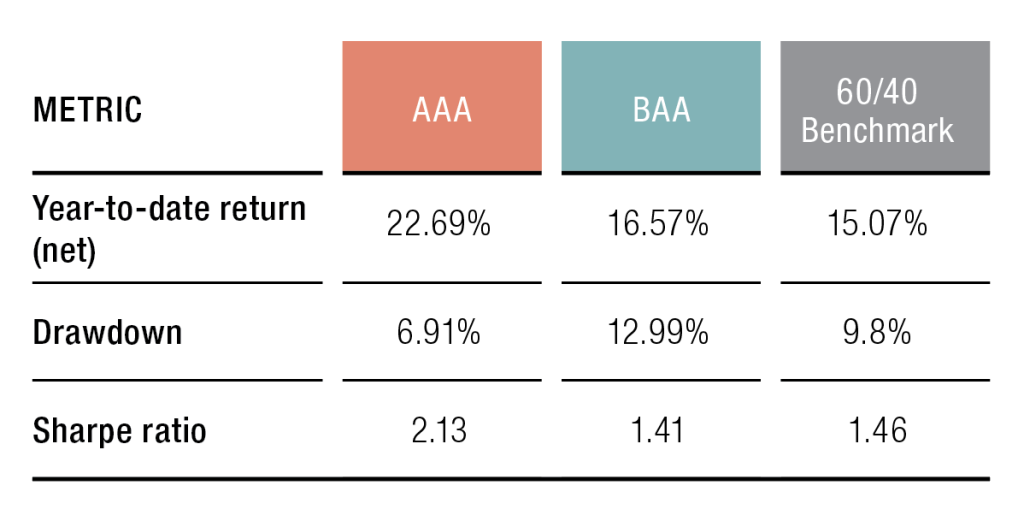
From 1 January to late November 2025, both strategies outperformed the benchmark, with AAA in particular benefiting from its ability to rotate quickly. BAA’s regime-switching mechanism led to a high initial allocation to defensive assets, partial de-risking in the spring and a renewed risk-on stance in the second half of the year. In both cases, the result is a pattern of returns that participates meaningfully in rising markets while seeking to limit the depth of interim drawdowns, leaving each strategy ahead of a traditional 60/40 allocation over the most recent year and over the broader backtest horizon.
[1] Keller, W. J. (2022). Relative and absolute momentum in times of rising/low yields: Bold asset allocation (BAA). Low Yields: Bold Asset Allocation (BAA)(July 18, 2022).
[2] Butler, A., Philbrick, M., & Gordillo, R. (2016). Adaptive Asset Allocation: Dynamic Global Portfolios to Profit in Good Times-and Bad. John Wiley & Sons.
További cikkekBefektetési Kilátások 2026 Dokumentum megtekintéseLetöltésEz egy forgalmazási közlemény. A megalapozott befektetési döntés meghozatalához részletes tájékozódásra van szükség. Az Alap befektetési politikájáról, forgalmazási költségeiről és a befektetés lehetséges kockázatairól részletesen tájékozódjon az Alap forgalmazási helyein és az Alapkezelő weboldalán (www.vigam.hu) található Kiemelt Információkból, hivatalos tájékoztatóból és kezelési szabályzatból. A befektetési alap forgalmazásával (vétel, tartás, eladás) kapcsolatos költségek az alap kezelési szabályzatában és a forgalmazási helyeken megismerhetők. A múltbeli teljesítmény alapján nem jelezhetőek előre a jövőbeli hozamok. A befektetéssel elérhető jövőbeni hozam adóköteles lehet, az egyes pénzügyi eszközökre, ügyletekre vonatkozó adó- és illeték információkat pedig csak az egyes befektetők egyedi körülményei alapján lehet pontosan megítélni, ami a jövőben változhat. A befektető feladata, hogy tájékozódjon az adókötelezettségről. Jelen tájékoztatóban szereplő adatok kizárólag információs célokat szolgálnak és nem minősülnek befektetési ajánlásnak, ajánlattételnek vagy befektetési tanácsadásnak. A VIG Befektetési Alapkezelő Magyarország Zrt. nem vállal felelősséget a jelen tájékoztatás alapján hozott befektetési döntésért és annak következményeiért.
Az Alapkezelő alternatív befektetési alap kezelésére (ABAK) vonatkozó engedélyének száma: H-EN- III-6/2015. Az Alapkezelő ÁÉKBV-alapkezelési (kollektív portfóliókezelési) engedélyének száma: H- EN-III-101/2016.