 Download the material in pdf format by clicking on the image.
What happened in the last month?
In focus: America’s war in the Middle East
On February 28, the United States and Israel launched a joint military strike against Iran with the aim of toppling the current regime. Since then, the situation has escalated into a broader conflict. Beyond regime change, the objectives included weakening Iran’s military capabilities and preventing the country from acquiring nuclear weapons.
In response, Iran launched missile strikes targeting Israel as well as several military bases across the region, including those located in Kuwait, Bahrain, Qatar, Iraq, Saudi Arabia and the United Arab Emirates.
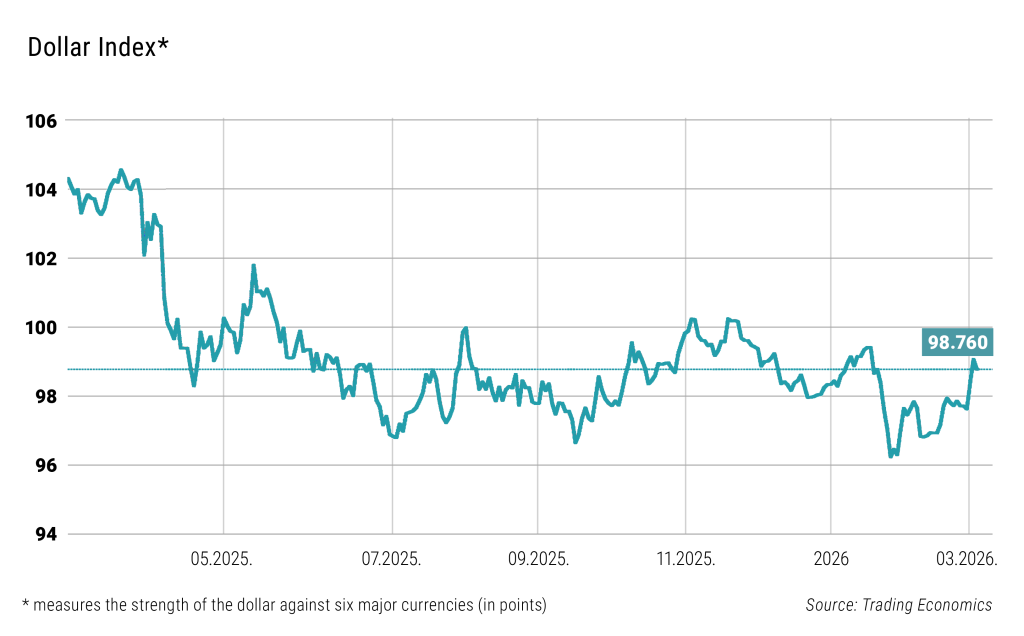
The rising geopolitical tensions and military developments have triggered significant volatility across global financial markets. The US dollar – once again acting as a safe-haven currency – strengthened after nearly a year of weakness, which is hardly surprising given the United States’ position as the world’s leading military and economic power. At the same time, risk reduction weighed on riskier asset classes such as equities and cryptocurrencies.
The energy market has been hit even harder. Qatar, the world’s largest LNG exporter, temporarily halted production following a drone attack, a disruption that could affect roughly 15% of Europe’s LNG imports. Meanwhile, Iran has also blocked the Strait of Hormuz, a critical shipping route through which several other Middle Eastern oil and gas producers transport their exports.
The greatest concern now is further escalation. A surge in oil prices could trigger a new wave of global inflation, leading to higher interest rates and a slowdown in economic growth – particularly in Europe. Nevertheless, the longer-term structural trends of the global economy are unlikely to take a complete 180-degree turn.

Equity market news
A shift is underway in the world’s largest equity market. Among the major US stock indices — which together account for roughly 40% of global market capitalization — both the S&P 500 and the Nasdaq declined, as large technology stocks came under selling pressure.
Shares of Amazon, for example, fell nearly 12% in February after the company announced plans to invest USD 200 billion in AI infrastructure – a figure many investors consider excessive. Nvidia’s stock dropped 5.5% in a single day, despite the company reporting otherwise strong results. Even companies whose growth was driven by the AI boom have seen significant declines. Shares of Duolingo, the language-learning platform, have fallen more than 80% since last May, reflecting shifting investor sentiment toward AI-related beneficiaries.
At the same time, the Dow Jones Industrial Average and the Russell 2000 small- and mid-cap index both posted gains, suggesting that market leadership is gradually broadening beyond the previously dominant large-cap technology stocks. The best-performing sectors were utilities, energy and basic materials, a pattern also seen in European markets, where equity indices had recently reached new all-time highs.
However, the outbreak of war triggered a market correction in several regions. For instance, South Korea’s KOSPI index fell by around 15% within just a few days, highlighting the sensitivity of global markets to escalating geopolitical tensions. South Korea’s KOSPI index, by contrast, has emerged as a clear beneficiary of the AI boom. Driven by a sharp rise in memory chip prices, the Seoul stock market surged by 20% in January.
Bond market news
Major central banks around the world have temporarily paused their rate-cutting cycles. In February, both the US Federal Reserve and market expectations shifted toward later and more modest rate cuts in 2026, with greater uncertainty surrounding both the timing and pace of easing. This reassessment is partly driven by geopolitical risks and persistent inflation concerns. Inflation has remained close to, but still above, the Fed’s 2% target, while labour market data have shown signs of stabilization. In January, employers created 130,000 new jobs, exceeding expectations, which helped push the unemployment rate down to 4.3%.
In Europe, policy rates have also remained unchanged. The European Central Bank (ECB) decided to keep interest rates on hold, and market pricing has not yet incorporated meaningful expectations of rate cuts. The newly emerging geopolitical tensions and the outbreak of war are also adding inflationary risks to the outlook. As a result, yields on government bonds have moved higher, with the 10-year US Treasury yield rising to around 4%, while the German 10-year Bund yield climbed above 2.7%.
Alternative investments news
Oil prices surged sharply in the wake of the escalating military conflict. This is hardly surprising, given that around 50-55% of the world’s proven oil reserves are located in this region. The price of Brent crude, the benchmark for Europe, briefly exceeded USD 85 per barrel (159 litres) in early March, driven by rising geopolitical tensions and supply risks, before stabilising above USD 70 per barrel. The latter level had not been seen since last summer, while prices above USD 85 were last recorded in October 2023.
The partial blockade of the Strait of Hormuz, the main maritime route out of the Persian Gulf, has disrupted shipping and constrained supply, further pushing prices higher. As global oil prices rose, fuel prices in Hungary also increased, with retail prices rising by HUF 5-8 per litre from 5 March 2026. Although the OPEC+ oil alliance announced a production increase of 206,000 barrels per day starting in April, Saudi Arabia and the United Arab Emirates currently face difficulties in exporting additional volumes as long as shipping routes in the Gulf remain disrupted. Meanwhile, gold – traditionally considered a safe-haven asset – has continued to strengthen, with its exchange-traded price stabilising above the psychological level of USD 5,000 per ounce (31.1 grams).
What can we expect in the coming period?
Investment clock
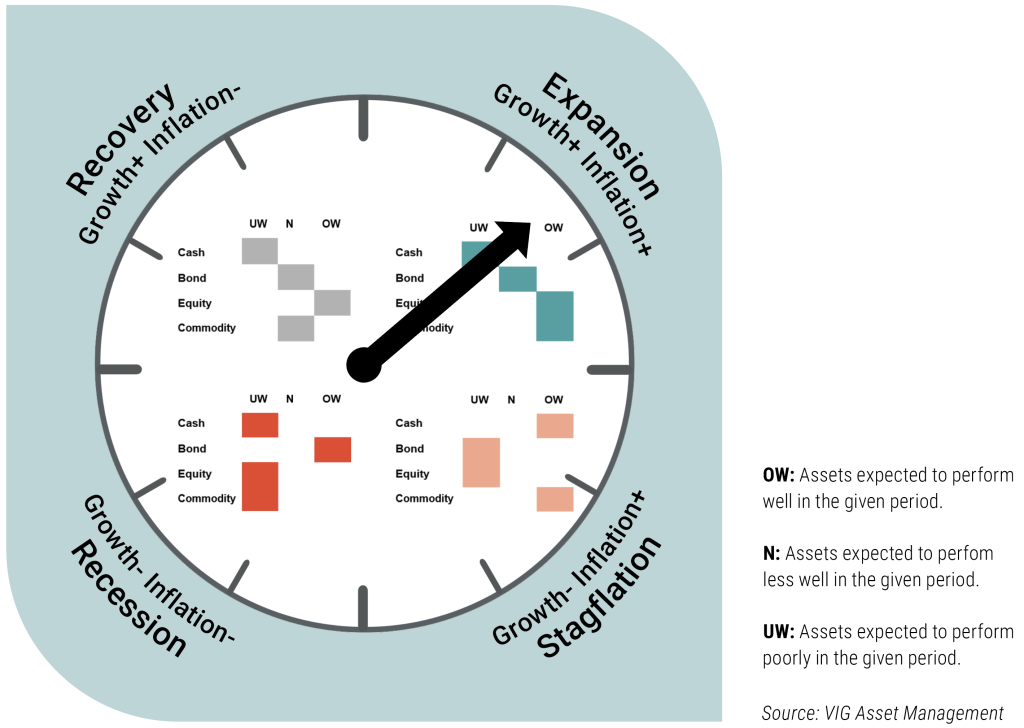
Accelerating economic growth accompanied by rising price levels – by March, VIG Asset Management’s Global Investment Clock, a science-based forecasting model that estimates the short-term economic cycle using forward-looking indicators, had moved into the expansion phase.
In line with this shift, equity markets have seen outperformance in the sectors highlighted by our model. Alongside the energy sector and basic materials, commodities have also delivered above-average performance. This development is consistent with forward-looking indicators pointing to stronger growth and rising inflationary pressures.
At the same time, the outlook varies across different regions. Currently, China is providing the strongest upward momentum to our leading indicator. The country’s headline manufacturing PMI rose to 52.1 in February from 50.3 in January, marking the highest reading since December 2020. Manufacturing output expanded at its fastest pace since June 2024, while new orders increased for the ninth consecutive month, with the growth rate reaching its strongest level since December 2020.
China, however, continues to lag behind. According to a Reuters poll, GDP growth may slow from 5% last year to 4.5% in 2026.
Tactical Asset Allocation
In line with the latest economic and capital market trends, we have adjusted our asset allocation. Developed market bonds remain underweight, as interest rate cuts – which would typically support fixed-income valuations – appear unlikely in the current environment. In contrast, emerging market bonds, including those in Hungary, offer attractive prospects thanks to their still significant yield premium.
A compelling opportunity: emerging market equities
We remain cautiously optimistic, as reflected in our preference for the higher-risk regions – Central and Eastern Europe and emerging markets excluding China. The expansion phase indicated by the Investment Clock tends to favour riskier assets, particularly equities.
Within emerging markets, South Korea and Taiwan could outperform due to their strong technology exposure. In Central and Eastern Europe, Poland and Hungary may stand out, supported by strong earnings revisions and capital inflows.
Caution with developed market bonds
Following the significant decline in yields, we have downgraded core developed market government bonds, as we currently see limited fundamental support for further price appreciation.
Further yield compression – which would typically lift bond prices – is not currently on the agenda in developed markets. In the United States, robust job creation, solid GDP growth and core inflation remaining above 3% reduce the likelihood of meaningful policy rate cuts. In Europe, rising inflation risks linked to the US-Iran conflict also make significant rate reductions less probable.
At the same time, Hungarian government bonds remain particularly attractive, offering compelling yield premiums and positive real yields – a genuine “sweet spot” for investors. We discuss this in more detail in our bond market update.
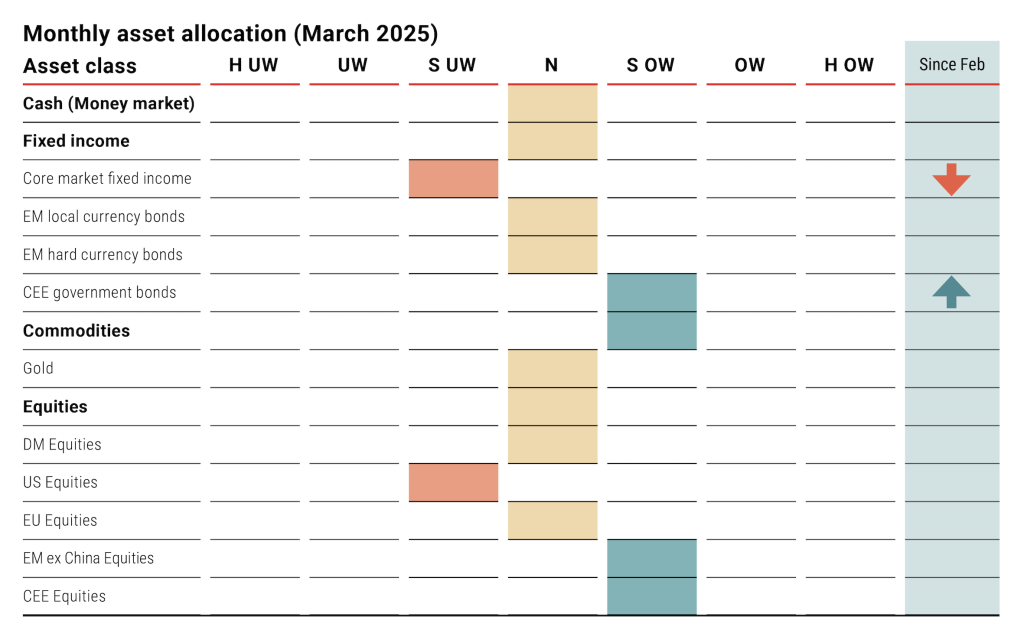
The weights indicate the evaluation of the respective country, region, and asset class, providing a basis for portfolio managers in structuring portfolios and establishing positions, thus helping to capitalize on market opportunities.
Weights:
- Strongly underweight
- Underweight
- Slightly underweight
- Neutral
- Slightly overweight
- Overweight
- Strongly overweight
Changes – change compare to the the previous month
The table was prepared based on our investment clock and quadrant modell**.
Focus fund: VIG Panoráma Absolute Return Investment Fund
The VIG Panoráma Absolute Return Investment Fund offers an attractive risk-return profile in the current global capital market and geopolitical environment.
The fund maintains a significant direct commodity exposure of around 30%, which provides upside potential in the current, longer-term expansionary phase of the economic cycle. At the same time, the prices of key commodities – particularly oil, natural gas and gold – are also being supported by the escalating geopolitical tensions in the Middle East.
The fund’s equity portfolio focuses on real-economy sectors that have performed well this year, allowing it to benefit from the ongoing sector rotation in global equity markets, where investor capital has been gradually shifting from technology stocks toward more traditional, cyclical industries.
For this reason, the actively managed VIG Panoráma Absolute Return Investment Fund can also serve as an effective tool for reducing exposure to AI-related risks. The excessive optimism surrounding artificial intelligence in recent years is increasingly giving way to a more sober market assessment. As the massive investments required by the technology raise questions about future returns, AI-related technology stocks have become more vulnerable to investor sell-offs, leading to more frequent price declines.
Based on our expectations (based on tactical asset allocation), the fund of the month may outperform in the near future.
VIG Panoráma Absolute Return Investment Fund
This is a distribution announcement. Detailed information is needed to make a well-founded investment decision. Please inform yourself thoroughly regarding the Fund’s investment policy, potential investment risks and distribution in the Fund’s key investment information, official prospectus and management regulations available at the Fund’s distribution outlets and on the Asset Management’s website (www.vigam.hu). The costs related to the distribution of the fund (buying, holding, selling) can be found in the fund’s management regulations and at the distribution outlets. Past returns do not predict future performance. Please note that in comparison with other investment funds, the return achieved may be affected by differences in the reference index and therefore the investment policy.
The future performance that can be achieved by investing may be subject to tax, and the tax and duty information relating to specific financial instruments and transactions can only be accurately assessed on the basis of the individual circumstances of each investor and may change in the future. It is the responsibility of the investor to inform himself about the tax liability and to make the decision within the limits of the law.
The information contained in this leaflet is for informational purposes only and does not constitute an investment recommendation, an offer or investment advice. VIG Asset Management Hungary Closed Company Limited by Shares accepts no liability for any investment decision made on the basis of this information and its consequences.
The Asset Management’s license number for managing alternative investment funds (AIFM) is: H-EN-III-6/2015. The Fund Manager’s license number for UCITS fund management (collective portfolio management) is: H-EN-III-101/2016.